 Reduction of lower motor neuron degeneration in wobbler mice by N-acetylcysteine
 Reduction of lower motor neuron degeneration in wobbler mice by N-acetylcysteine
Jeffrey T. Henderson, Mohammed Javaheri, Susan Kopko and John C. Roder
Samuel Lunenfeld Research Institute, Mount Sinai
Hospital,
Program in Molecular Biology and Cancer, 600
University Ave., Toronto, Ontario M5G-1X5
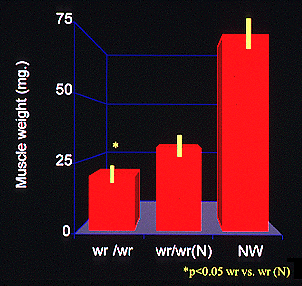
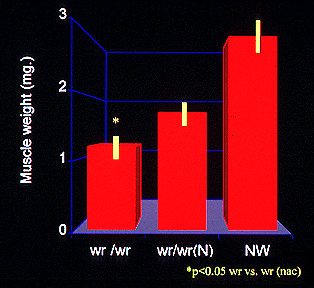
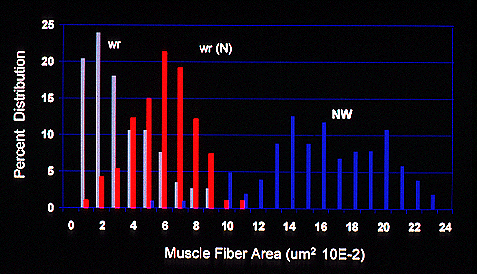
Figure 4. NAC reduces the atropy of forelimb muscle fibers in wobbler mice.
 A:
Plot of triceps muscle mass for each treatment group (n=12). Values represent the mean + S.E.M., (*) signifies a significant difference (p<0.05) compared to wr/wr group. For wr/wr vs. wr/wr(N), p<0.003.
 B: Plot of flexor carpi ulnaris muscle mass for each treatment group. n>12 animals per group, values represent the mean + S.E.M., (*) signifies a significant difference (p<0.05) compared to wr/wr group. For wr/wr vs. wr/wr(N), p<0.021.
 C: Percent distribution of muscle fiber areas. For each treatment group, mean cross-sectional areas were determined for 70 muscle fibers in each of four separate individuals. Muscle cross-sections were taken the midpoint of the main body of the flexor carpi ulnaris. Areas were then determined for the medial fibers within each cross-section. All fiber areas were determined in a blinded manner from coded one micron thin sections.
For each pair-wise comparison of the treatment groups (wr/wr:wr/wr(N), wr/wr:NW, wr/wr(N):NW) p values were <0.001.
See also:
photos of muscle fiber cross sections
.
.